Quant Analyzer Portfolio Report
Forex Atlantis
Total Profit
$ 412119.82
Profit in pips
43742.4 pips
Yrly Avg profit
$ 58874.17
Yrly Avg % ret
117.75 %
CAGR
37.39 %
# of trades
25972
Sharpe ratio
0.16
Profit factor
1.98
Return / DD ratio
59.36
Winning %
78 %
Drawdown
$ 6943.15
% Drawdown
4.55 %
Daily Avg profit
$ 188.61
Mthly Avg profit
$ 4906.19
Average trade
$ 15.87
Annual% / Max DD%
8.22
R Expectancy
0.22 R
R Exp score
799.16 R
SQN
31.25
SQN score
112.48
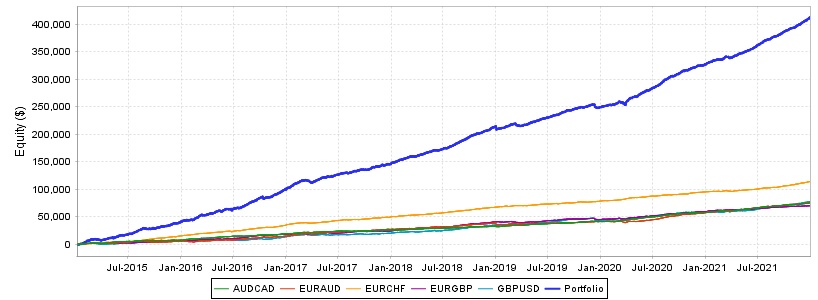
Strategies in portfolio
| # | Name | Symbol | Timeframe | Net Profit ($) | Net Profit (pips) | # of Trades | Sharpe Ratio | Profit Factor |
| S1 | AUDCAD | AUDCAD | unknown | $ 74834.75 | 9554 pips | 5008 | 0.15 | 2.17 |
| S2 | EURAUD | EURAUD | unknown | $ 76405.95 | 10766.3 pips | 6258 | 0.12 | 1.66 |
| S3 | EURCHF | EURCHF | unknown | $ 113573.53 | 10508.2 pips | 4942 | 0.23 | 3.16 |
| S4 | EURGBP | EURGBP | unknown | $ 69742.59 | 5157.6 pips | 4565 | 0.14 | 1.87 |
| S5 | GBPUSD | GBPUSD | unknown | $ 77563 | 7756.3 pips | 5199 | 0.1 | 1.72 |
| # | Name | Return / DD Ratio | Winning % | Drawdown | % Drawdown | Yearly avg. profit | Monthly avg. profit | Daily avg. profit |
| S1 | AUDCAD | 49.51 | 79.43 % | $ 1511.58 | 5.82 % | $ 10690.85 | $ 890.89 | $ 35.52 |
| S2 | EURAUD | 21.23 | 82.92 % | $ 3599.36 | 19.7 % | $ 10915.14 | $ 909.59 | $ 41.17 |
| S3 | EURCHF | 67.78 | 75.96 % | $ 1675.59 | 6.83 % | $ 16223.87 | $ 1352.07 | $ 59.43 |
| S4 | EURGBP | 24.69 | 71.76 % | $ 2824.95 | 9.84 % | $ 9964.1 | $ 830.27 | $ 34 |
| S5 | GBPUSD | 16.51 | 78.09 % | $ 4699 | 21.65 % | $ 11079.92 | $ 923.37 | $ 41.1 |
Monthly Performance ($)
| Year | Jan | Feb | Mar | Apr | May | Jun | Jul | Aug | Sep | Oct | Nov | Dec | YTD |
| 2021 | 7265.91 | 2037.12 | 3039.92 | 7520.07 | 5821.31 | 8656.94 | 9386.99 | 7532.89 | 7358.09 | 7425.36 | 7478.45 | 11993.43 | 85516.48 |
| 2020 | 4004.05 | 2926.19 | 1731.18 | 10524.54 | 7303.43 | 7990.06 | 8920.72 | 10851.62 | 6223.16 | 6159.76 | 6412.78 | 4383.57 | 77431.06 |
| 2019 | -1981.28 | 5522.44 | -2753.71 | 4954.88 | 5400.25 | 4852.65 | 4723.13 | 5911.99 | 4824.72 | 3217.68 | 4401.59 | -3863.88 | 35210.46 |
| 2018 | 7719.96 | 3902.41 | 2804.12 | 5067.53 | 5881.84 | 1815.33 | 5367.23 | 8570.27 | 7512.83 | 7018.88 | 5126.16 | 7654.14 | 68440.7 |
| 2017 | 10360.52 | 5667.87 | -3558.44 | 6762.57 | 3414.58 | 4369.02 | 3839.39 | 2518.3 | 2085.54 | 5331.96 | 3907.51 | 1474.03 | 46172.85 |
| 2016 | 2536.07 | 5551.8 | 4711.97 | 4778.37 | 3640.19 | 2220.28 | 2716.69 | 8665.71 | 7925.35 | 1249.93 | 5925.51 | 8227.56 | 58149.43 |
| 2015 | 3587.95 | 4780.03 | -641.07 | 3279.2 | 4520.72 | 2161.88 | 6080.29 | 4141.04 | 50.62 | 4289.92 | 3837.27 | 5110.99 | 41198.84 |
Stats
Strategy
| Wins/Losses Ratio | 3.54 | Payout Ratio (Avg Win/Loss) | 0.56 | Average # of Bars in Trade | 0 |
| AHPR | 0.01 | Z-Score | -55 | Z-Probability | 99.9 % |
| Expectancy | 15.87 | Deviation | $ 81.84 | Exposure | -999999999 % |
| Stagnation in Days | 75 | Stagnation in % | 2.93 % |
Trades
| # of Wins | 20257 | # of Losses | 5715 | # of Cancelled/Expired | 0 | ||
| Gross Profit | $ 833153.4 | Gross Loss | $ -421033.58 | Average Win | $ 41.13 | Average Loss | $ -73.67 |
| Largest Win | $ 405.88 | Largest Loss | $ -502.47 | Max Consec Wins | 52 | Max Consec Losses | 8 |
| Avg Consec Wins | 6.91 | Avg Consec Loss | 1.95 | Avg # of Bars in Wins | 0 | Avg # of Bars in Losses | 0 |